About the NSW Climate Data Portal
Purpose
The NSW Climate Data Portal allows users to access outputs of the New South Wales (NSW) and Australian Capital Territory (ACT) Regional Climate Model (‘NARCliM’) project. Users of the NSW Climate Data Portal (the ‘Portal’) can search, select and download datasets (i.e. simulations and variables), or construct interactive selections to extract.
Users can choose locations, time periods and climate variables that are of interest to them. These data requests are retained on the Portal and assembled into ‘data collections’ that can be viewed by other registered users of the Portal.
The Portal currently reads binary files of data output by the NARCliM simulations and provides data in two formats: American Standard Code for Information Interchange (ASCII) and comma-separated values (CSV).
Audience
The Climate Data Portal is intended to support a broad range of climate data users, including climate impact researchers, risk analysts, project managers across the spectrum of industries, both public and private sectors, and higher education and not-for-profit organisations.
The Portal provides data from individual simulations to multi-simulation summaries, at a range of time scales and format.
The data is designed to be suitable for a variety of research and modelling needs. In addition, there are a wealth of climate data products for the NARCliM projections released in 2014 (also known as ‘NARCliM1.0’). These were developed to inform state and regional snapshot reports and are available from the AdaptNSW website.
We welcome your feedback. If you would like to see additional data offerings made available here, please contact us at narclim@environment.nsw.gov.au.
Data use
NARCliM data provides the most comprehensive and reliable view of future climate. It is built with the same data used by the Intergovernmental Panel on Climate Change. The data available here can be used for a range of purposes. NARCliM data can support scientific research of the impacts of climate change, including climate impacts on carbon sequestration, ecology, coastal erosion, water catchment management and more. For example, the NARCliM data projections released in 2014 have already informed major strategic planning initiatives such as the NSW State Infrastructure Strategy (2018–2038), Future Transport 2056, Greater Sydney Region Plan, NSW State Level Emergency Risk Assessment, and regional water strategies by the Department of Industry.
How to get started
To access and download data from the Climate Data Portal you must be a registered user. To set up an account, please navigate to the Register tab on the homepage and enter the required information. Here, in addition to personal details, you will be asked to identify your data needs. Based on this information, users will be provided access to different packages of data. Further details about accessing data on the Climate Data Portal are available here.
Need a definition for some of the terms you are seeing as you navigate the Climate Data Portal to discover and download data? Please review the Portal’s Glossary of Terms. In most cases, a short version of the definition appears when you hover over the word.
There are fundamental considerations in your decision to access the climate data available through the Climate Data Portal. In advance of registration, you are encouraged to review the Terms and Conditions that govern use of the data.
Contact us
Do you have questions about using the Climate Data Portal? Need to know more? Please contact us at: narclim@environment.nsw.gov.au
Would you like to provide feedback? We invite you to complete a short survey at: https://oeh.au1.qualtrics.com/jfe/form/SV_5hbO4NZGILKAGDc
CLIMATE PROJECTIONS FOR NSW AND THE ACT
About the NARCliM climate projections
The New South Wales (NSW) and Australian Capital Territory (ACT) Regional Climate Modelling (‘NARCliM’) Project began in 2011. The project was undertaken because regional decision-makers and impact assessment researchers needed high-resolution climate change projections. Previously, climate change information had been at a scale that could not be used for localised, regional decisions.
NARCliM has produced an ensemble of robust regional climate projections for south-eastern Australia that can, for example, be used by the NSW and ACT community to plan for a range of likely future changes in climate1.
NARCliM is a research partnership between the NSW, ACT and South Australian governments and the Climate Change Research Centre at the University of New South Wales.
These partnerships have provided oversight and technical guidance for the development and quality management of NARCliM outputs.
The first NARCliM climate projections (‘NARCliM1.0’) were first released in 2014. The next generation of climate projections (‘NARCliM1.5’) was released in late 2020.
Modelling future climate on a regional scale: NARCliM and CORDEX domains
The NARCliM data provides dynamically downscaled climate projections for two domains:
- The whole of Australasia. The extent and spatial resolution of this domain was chosen to be consistent with the Coordinated Regional Climate Downscaling Experiment (CORDEX) framework2, and hence is called the ‘CORDEX domain’ (see black box on map below). It was modelled at a 50-kilometre resolution.
- A region of south-eastern Australia, called the ‘NARCliM domain’ (see red box on the map) was modelled at a 10-kilometre resolution3.
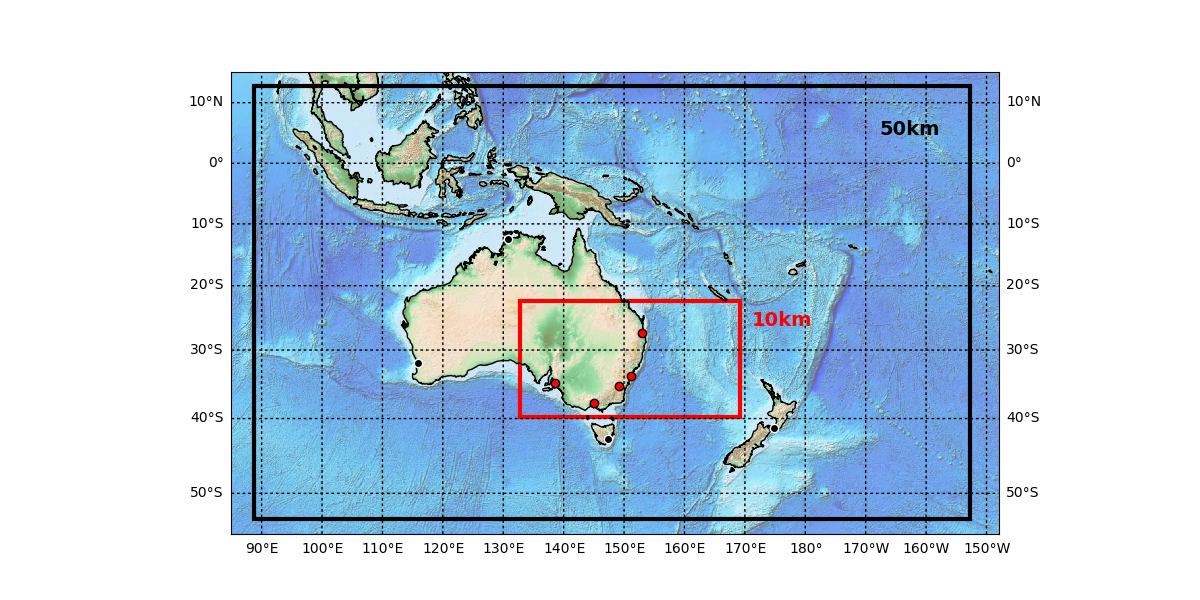 The CORDEX and NARCliM domains
The extent and spatial resolution of the NARCliM domain was chosen to provide robust simulations of NSW and ACT climate, particularly as this section of the eastern seaboard contains almost half the population of Australia. The domain covers a large area of ocean and the Tasman Sea. This was specifically chosen to capture offshore climate events such as storms generated from east coast lows that bring important rainfall to New South Wales. In the map, Australian capital cities in the inner 10-kilometre domain are shown with red dots and those outside the 10-kilometre domain are shown with black dots.
NARCLIM CLIMATE MODEL SELECTION
Global and regional climate models
The NARCliM projections have been generated from four global climate models (GCMs) and dynamically downscaled by three regional climate models (RCMs). This creates a 12 model ensemble.
The four selected GCMs (MIROC, ECHAM, CCCMA and CSIRO Mk3.0) form part of the World Climate Research Program's (WCRP) Coupled Model Inter-comparison Project phase 3 (CMIP3) models, which were used by the Intergovernmental Panel on Climate Change (IPCC) for its Fourth Assessment Report. The Weather Research and Forecasting (WRF) regional climate model (RCM) has been used to dynamically downscale projections from the GCMs.
This ensemble approach is used to ensure robust climate projections that are at the regional scale span the likely future climate. The 12 models were run using a single, representative emissions scenario: the IPCC high emissions scenario A2 from the Special Report on Emissions Scenarios. The 12 models were run for three time periods: 1990 to 2009 (base), 2020 to 2039 (near future), and 2060 to 2079 (far future). A reanalysis dataset is also available for the period 1950 to 2009.
GCM selection
Regional climate modelling requires substantial computing and data storage facilities, restricting the number of GCMs that could be used for NARCliM. This meant that a systematic approach was required to ensure the best choices of GCMs for NARCliM.
The GCMs were chosen such that the full range of uncertainty within the CMIP3 GCMs was captured by models that simulated the NSW climate well. Even if a GCM can simulate the current climate, it may not necessarily be able to simulate the future climate well. Choosing GCMs that span the range of projected future climate reduces the uncertainty of the projections.(1)
The NARCliM GCMs were selected by using a three-stage process:(4)
- The performance of a total of 23 CMIP3 GCMs was evaluated, and models that did not adequately simulate the historical climate were removed.
- The set of GCMs that performed well was then ranked on the basis of a measure of their independence (i.e. whether they exhibited the same strengths and weaknesses in their representation of the climate).
- The GCMs were then evaluated on the basis of their projections of future climate change. The most independent models that spanned the largest range of plausible future climates were chosen.
The selection process referred to the published scientific literature to identify GCMs that performed poorly over south-eastern Australia. The performance of each of the 23 CMIP3 models was ranked on the basis of the findings of 12 independent, peer reviewed studies. Further information on individual model performance and study references is provided in Technical Note 1, Table 1: Summary of model assessments. The six worst-performing models were removed from further analysis.
The remaining GCMs were then ranked on the basis of independence,(5) focusing on daily mean temperature and precipitation, as these variables are of the most interest to users of climate change information. Further information on individual model performance is provided in Technical Note 2, Table 2: The absolute GCM independence coefficient for each model.
Each of the models’ projected changes in future temperature and rainfall were then mapped and the four most independent models spanning the extent of future climate change were chosen. Further information is provided in Technical Note 1, Figure 1: Future change space for the GCMs.
The GCMs selected for NARCliM were MIROC3.2 (medres), ECHAM5, CCCM3.1 and CSIRO-Mk3.0.
RCM selection
To further ensure that the NARCliM projections spanned the range of uncertainty in regional climate models, a process similar to that used for GCM selection was used to choose the best regional climate models.(6)
- The performance of RCMs was evaluated over south-eastern Australia and models that did not adequately simulate the climate were removed.
- From the set of RCMs that performed well over south-eastern Australia, a subset was chosen so that each RCM was as independent as possible from the others.
The WRF modelling system has been demonstrated to be effective in simulating temperature and rainfall in NSW(7,8) and provides good representations of local topography and coastal processes. This model was jointly developed by several major research centres in the US and is widely used internationally.(9,10)
The WRF modelling system has different settings that reflect uncertainties in our understanding of some physical processes. Varying these settings among model runs and using several different settings with each GCM provides a more realistic set of projections. Performing multiple model runs also captures more reliable information on rare, extreme weather events, such as heatwaves, heavy rain and drought.
For evaluation, the WRF model was run with 36 different physics scheme settings using combinations of the Cumulus convection scheme, the cloud microphysics scheme, radiation schemes and the Planetary Boundary Layer scheme.
Because of computational limitations, not all RCM combinations could be included in the full NARCliM project. The performance and independence of each RCM were evaluated and used to simulate a range of storm types that affect the state, such as East Coast Lows, with performance testing for precipitation, minimum and maximum temperatures, mean sea level pressure and wind.(1,11,12)
The RCM ensemble was evaluated over south-eastern Australia in order to remove any models that were not able to adequately simulate the climate. From the set of RCMs that performed well, a subset was chosen, so that each was as independent as possible from the others. On the basis of model performance and independence, three WRF model configurations were selected for use in the downscaling.
| NARCliM RCM | Planetary boundary layer physics / surface layer physics | Cumulus physics | Microphysics | Short-wave / long-wave radiation physics |
|---|---|---|---|---|
| RCM1 | MYJ/ Eta similarity | KF | WDM 5 class | Dudhia/RRTM |
| RCM2 | MYJ/ Eta similarity | BMJ | WDM 5 class | Dudhia/RRTM |
| RCM3 | YSU/MM5 similarity | KF | WDM 5 class | CAM/CAM |
NARCliM PERFORMANCE AND BIASES
Performance of NARCliM GCMs and RCMs
Climate models provide projections of future climate changes derived from fundamental principles of the climate system. An advantage of this approach is that future changes in all climate variables are derived together in a physically consistent way. A disadvantage is that models cannot perfectly represent the Earth’s climate – some regions of the modelled climate may be slightly hotter or drier, for example, than the climate we experience in reality. These differences are known as error or bias.
Despite climate modelling representing the best available information on plausible future climates, no climate model provides a perfect representation of the real climate system. For this reason there are differences between the output of the NARCliM simulations and observations of the climate.(13)
The performance of the global climate models (GCMs) and regional climate models (RCMs) selected for NARCliM are discussed below, and preliminary findings on the performance of the NARCliM modelling presented.
Despite selection of GCMs based on performance, it is notable that a significant spatial scale problem exists between the scale of the processes that GCMs can represent (larger than about 300 km) and the scales of interest for impacts and adaptation studies which are often only tens of kilometres or less.
Dynamic downscaling with RCMs was found to capture climate phenomena not resolved by GCMs including the influence of mountains, coastlines and local land-atmosphere feedbacks. Results indicate that the NARCliM simulations more adequately resolve spatial and temporal variations in the NSW climate, and particularly in the climate of the eastern seaboard.
Initially a technical quality assurance process was undertaken to identify any issues. This involved checks on the size, number, inner structure and format of model output files, metadata quality assurance, and checks on geographical coordinates and time steps.
Basic scientific quality assurance was subsequently conducted for post-processed climate variables to check that these variables fall within a reasonable range, with the range selected based on the observation record.(15)
Intermediate scientific quality assurance has been undertaken for key variables such as rainfall, temperature and wind with model projections compared to observational estimates and errors quantified using various statistics such as mean bias.
Advanced scientific quality assurance is also being conducted for some special climate systems, with advanced diagnostics being applied to test how well the NARCliM simulations account for such systems (e.g. East Coast Lows).(16) The degree to which simulations reproduce the main drivers of NSW climate is also under investigation.
Quality assurance is an ongoing process that incorporates NARCliM user feedback. Registered user should provide descriptions of any identified issue(s) to DPIE (narclim@environment.nsw.gov.au). This should include a description of the issue(s), the variable, location and model time of the problem, and the name of the file containing the problem.
Known biases and issues in NARCliM
Climate models are not perfect and often display errors or biases in their modelled climates. For some applications these biases may present significant difficulties when attempting to use the projected climates, particularly if the impact or application is sensitive to non-linearities in the system such as threshold effects (e.g. the number of days with temperatures above 35°C).
The chosen RCMs were found to act independently but do have a tendency towards overestimating precipitation and underestimating maximum temperature. Therefore, in addition to making available the actual NARCliM output data set, statistical methods were used to correct NARCliM model bias and produce a bias-corrected data set. Only rainfall and temperature (minimum and maximum) were bias corrected as they are the only variables with long, reliable observational time series on which to base the bias correction.
The method used to produce bias-corrected data is outlined in Technical Note 3. Given that bias correction removes the physical consistency between climate variables, this technical noted also present guidelines to consider when deciding whether to use actual model output or bias-corrected data.
NARCliM CCCMA3.1 simulations
There is no daily data for any variable for 29 February on any year for the NARCliM CCCMA3.1 simulations. This is because the CCCMA3.1 Global Climate Model that is being downscaled works on a calendar that has no leap years.
Evaporation data
At present, no evaporation data are available from the NSW Climate Data Portal. A dataset for potential evaporation has been generated from other climate variables and will be made available through the data portal in the future.
Mean surface air temperature (tasmean)
The daily tasmean datasets contain spatial discontinuities/gaps over the ocean. This is likely due to discontinuities in data from the Global Climate Models that are being downscaled. These discontinuities coincide with discontinuities in the daily hussmean (mean surface specific humidity) datasets. Monthly data and data over the land are not affected.
Precipitation accumulation (pracc_fl)
A known issue with the Regional Climate Model's convection scheme resulted in unrealistically large values for isolated gridpoints for some time steps in the NARCliM simulations. The NARCliM 50 kilometre resolution data is most impacted. The pracc_fl files contain data in which these unrealistic values of daily precipitation above 1200 millimetres have been filtered out. Over the entire domain a very small number of data points are affected. To correct this the average rainfall of four surrounding grids was used to replace the unrealistic value of daily rainfall.
Precipitation accumulation - bias corrected (pracc_bc)
There are some spatial discontinuities in this dataset in some remote inland areas of the Northern Territory, Queensland and South Australia. This is due to the scarcity of observational climate data in these areas. In these areas, the Australian Water Availability Project (AWAP) gridded dataset used for bias correction relies heavily on interpolation of data between a small number of meteorological observation stations. Therefore, an alternative bias-correction approach that used regional-average data, rather than data for individual grid points, was used in these areas. For further information, please see NARCliM Technical Note 3.
Mean surface specific humidity (hussmean)
The daily hussmean datasets contain spatial discontinuities/gaps over the ocean. This is likely due to discontinuities in data from the Global Climate Models that are being downscaled. These discontinuities coincide with discontinuities in the daily tasmean (mean surface air temperature) datasets. Data over the land are not affected.
Mean sea surface temperature (sstmean)
The daily sstmean datasets for the NARCliM MIROC3.2 simulations contain spatial discontinuities in December 1991. This is due to discontinuities in data from the MIROC3.2 Global Climate Model that is being downscaled. Monthly data are not affected.
Statistical robustness
Because the state of the atmosphere, land, ocean and cryosphere changes from year to year, climate scientists do not analyse individual years from climate projections but use averages of multiple decades to describe the state of the climate. This is why base periods are multi-decadal in length (see above). Thus, when users are interested in a particular future year in NARCliM they should use an average of the surrounding years. For example, instead of looking at the climate in 2070, use the 20 year average from 1960 to 1979. Generally, the more years you include in your analyses the more reliably you can determine statistically significant changes.
The climate projections in NARCliM are based on different global climate model inputs and different configurations of the Weather Research and Forecasting (WRF) regional climate model. Using multiple climate projections, like those provided in NARCliM, as opposed to single projections also improves confidence in your analysis, since uncertainty in our knowledge of the climate is being accounted for. For example, knowing that multiple models agree on the direction of change for a variable (e.g. that the daily temperature range decreases into the future over Sydney) provides high confidence in the result, whereas if some models show an increase and others show a decrease there is less confidence in the result, even if the average over all projections happens to be a large number.
Certainty and uncertainty
What are the sources of uncertainty in climate projections?
Uncertainty about future climate projections comes from several sources. Here these sources of uncertainty are broken down into three main categories (17). The first source of uncertainty, and one of the largest unknowns, is the future emissions of greenhouse gases and aerosols. Since this uncertainty is impossible to quantify mathematically, it is presented as a series of possible emission scenarios or projections. These scenarios are then used in GCM simulations to study the impact on climate.
The second and the third sources of uncertainty deal with the response of the physical system to the increase in greenhouse gases and aerosols. Specifically, the second source is a large scale response to changes in atmospheric constituents. It can be sampled by using different GCM (“model structural uncertainty”), and different parametrisations within a single GCM (“model parametric uncertainty”). The third source is a local response given a large-scale response. In the case of RCMs this includes the uncertainty in model physics and structure similar to issues associated with GCMs, while for statistical downscaling this includes uncertainties associated with the statistical technique used. In combination these sources of uncertainty provide a limit to the confidence that can be placed in any particular projection of future regional climate.
Please see the Data Disclaimer below.
How is uncertainty addressed in regional climate modelling?
Quantifying uncertainty is done by creating a collection, or ensemble, of climate simulations that sample various parts of the uncertainty described above. Emission scenario uncertainty is addressed by running simulations from more than one scenario. To quantify the structural uncertainty associated with GCMs an ensemble of many GCMs should be used and similarly for RCMs (or dynamical downscaling) many RCMs should also be used. Ideally these GCMs and RCMs would be independent of each other ensuring they are sampling different parts of the plausible future climate space. Once an ensemble sampling these uncertainties has been established there are multiple methods for combining the information to establish a probabilistic future climate change prediction. Déqué and Somot (2010)(18) used a technique that weighs a frequency distribution based on model performance. Bayesian analysis has also been used in a number of ways (Tebaldi et al., 2004(19), 2005(20); Buser et al., 2010)(21) and is still an area of active research.
How was uncertainty addressed in the NARCliM modelling?
Due to the many uncertainties involved in producing climate projections, NARCliM is providing an ensemble of 12 simulations (rather than a single projection). Model independence however means that the chosen models do not exhibit the same strengths and weaknesses in their representation of the climate.
The WRF modelling system was run with different settings which reflect uncertainties in our understanding of some physical processes. Varying these settings between model runs and using several different settings with each GCM provides a more realistic set of projections. Performing multiple model runs also captures more reliable information on rare, extreme weather events, such as heatwaves, heavy rain and drought. Initially the WRF model was run with 36 different physics scheme settings, with model performance tested for five climate variables. On the basis of model performance and independence, three WRF model configurations were selected for use in the downscaling.(4)
Interpreting Future Climate Projections
Using ensemble projections
Due to the uncertainties involved in producing climate projections, NARCliM is providing an ensemble of 12 simulations (rather than a single projection). Each of these simulations represents an “equally plausible” future climate, with the range of future changes within the ensemble providing a measure of the confidence in any particular change.
The use of all 12 ensemble members is recommended to estimate climate change impacts ensuring an “equally plausible” range of possible impacts. If this is not possible (due to logistical constraints etc.), you could choose a smaller number of simulations (two or four) that span the range of the climate variable for which your system is most sensitive.
You could also use the central estimate (multi-model mean), keeping in mind the confidence range of the full ensemble.
What is the central estimate and how should it be used?
Central estimates of future climate change are used to summarise changes projected by the 12 modelling simulations undertaken for NARCliM. Multi-model median and multi-model mean are commonly used internationally to provide a reasonable “middle” projection.
The multi-model mean method was used to provide a central estimate for the NARCliM projections because of the model independent measure used to select the four GCMs. GCMs that are most independent contribute the most independent information in calculating a multi-model mean. This means that the multi-model mean of a selection of highly independent GCMs from a larger ensemble of GCMs (e.g. the CMIP3 ensemble) should be closer to the multi-model mean of the larger ensemble than the multi-model mean of a selection of GCMs that are less independent.
When using central estimates it is important to note the level of model agreement on the direction of change. If models are projecting both increases and decreases, the multi-model mean is likely to be within the range of model uncertainty and needs to be interpreted with caution. In such cases, reference should be made to maps showing the suite of individual simulation projection results and to location-specific bar graphs showing the span of plausible changes.
What does model agreement mean?
Model agreement refers to the number of individual model simulations within the ensemble that agree on the direction of change (e.g. increase or decrease in rainfall) and is used to determine the level of confidence in the change projected. The more models agree, the greater the confidence in that direction of change.
For example, if all simulations project a rainfall decrease for an area then this decrease has high confidence. If nine of twelve simulations project a rainfall decrease for an area then this decrease has medium confidence.
Selection of CMIP3 models
NARCliM utilises an ensemble of GCMs that were developed as part of the Coupled Model Intercomparison Project (CMIP). CMIPs are gathered and reviewed by the Intergovernmental Panel on Climate Change (IPCC) for the international climate change Assessment Reports.
- CMIP3 is the model ensemble for the IPCC’s Fourth Assessment Report (AR4) and was released in 2010. The NARCliM project uses models from this ensemble as input into the Weather Research and Forecasting regional climate model.
- CMIP5 is the model ensemble for the IPCC’s Fifth Assessment Report (AR5) and was released in 2013. The next set of climate projections for NSW will use models from this ensemble as input into the Weather Research and Forecasting regional climate model.
- CMIP6 is the model ensemble for the IPCC’s yet-to-be-released Sixth Assessment Report (AR6). CMIP6 models are currently being evaluated.
The following section includes a comparison of CMIP3 and CMIP5. CMIP6 has only recently been released and as results from these models become published a brief summary of the differences to previous generations of CMIP will be evaluated.
The CMIP3 and CMIP5 datasets each contain output from a large number of global climate models. CMIP5 contains more models than CMIP3 and the CMIP5 models are more advanced.
Both the CMIP3 and CMIP5 global climate models have been used to generate projections of future climate conditions across the globe. A direct comparison between the projections from the two datasets is not possible, as they use different scenarios describing the amount of greenhouse gas in the atmosphere in the future. CMIP5 uses Representative Concentration Pathways, whereas CMIP3 uses scenarios from the Intergovernmental Panel on Climate Change’s (IPCC) Special Report on Emissions Scenarios.
The IPCC notes that, for both large-scale climate patterns and the magnitudes of climate change, there is overall consistency between the projections based on CMIP3 and CMIP5. Differences in global temperature projections are largely attributable to a change in scenarios.
Further analysis by CSIRO that has focused on Australia and the Asia-Pacific region shows that the responses of temperature and precipitation in the region to an increase in global average temperature are similar between the CMIP3 and CMIP5 datasets. However, the CMIP3 simulations show a greater tendency towards decreases in precipitation in central and eastern Australia than do the CMIP5 GCMs.(26)
A more detailed comparison of the CMIP3 and CMIP5 datasets is provided by the IPCC(26) and, for Australia, by CSIRO.
EMISSIONS SCENARIOS
What is an emission scenario?
An emissions scenario is an estimate of future emissions based on our understanding of natural sources of greenhouse gases and on assumptions about future socio-economic trends, i.e. how much greenhouses gases will be released into the atmosphere by humans.
Because it isn’t clear exactly how global social and economic systems will respond to emissions reduction programs a range of scenarios are used to describe possible future trends in emissions of greenhouse gases into the atmosphere.
In 2010 the Intergovernmental Panel on Climate Change (IPCC) Special Report on Emission Scenarios (SRES) outlined emission scenarios that were used in the IPCC’s ensemble of climate models (CMIP3) for the IPCC’s Fourth Assessment Report (AR4).These ranged from A1FI (a future world of rapid economic growth with fossil-intensive technologies) to B1 (rapid transformation to a service and information economy with clean and resource-efficient technologies).
These scenarios provide a range of changes to the climate in response to the emissions: the A2 scenario is projected to result in warming by approximately 3.4°C by 2100. The more optimistic B1 scenario projected a warming of the planet by 1.8°C by 2100.
Why did we use the SRES A2 emissions scenario for NARCliM?
The NARCliM project uses a single emissions scenario, the SRES A2 scenario. At the time that NARCLIM started, in 2010, the SRES emission scenarios underpinning the IPCC’s Third Assessment Report (2001) and Fourth Assessment Report (2007) were the only set of emission scenarios available at the time.
The SRES A2 emission scenario was selected for the NARCliM climate projections because it reflected trends in global emissions.(22,23) Recent publications have confirmed that we are tracking at the higher end of the A2 scenario.(24)
What is a representative concentration pathway (RCP)?
In 2013 the Intergovernmental Panel on Climate Change released the Fifth Assessment Report which was based on the fifth phase of the Coupled Model Intercomparison Project (CMIP5), which incorporates the latest versions of climate models and focuses on a new set of scenarios. These scenarios span a range of plausible radiative forcing scenarios called representative concentration pathways (RCPs). Radiative forcing, measured in watts per square metre (W/m²), is the extra heat the lower atmosphere will retain because of the presence of additional greenhouse gases and aerosols.
Representative concentration pathways take into account the impact of atmospheric concentrations of greenhouse gases and aerosols (such as sulfate and soot), along with the uncertainty in possible future emissions.
The RCPs span a wider range of possibilities than the SRES emission scenarios. The RCPs include a very low forcing level (RCP2.6), two medium stabilization scenarios (RCP4.5 and RCP6), and one very high emission scenario (RCP8.5). The RCP8.5 pathway, which arises from little effort to reduce emissions and represents a failure to mitigate warming by 2100, is similar to the highest SRES scenario. The next iteration of NARCliM will utilise CMIP5 models as their input and hence will use RCP’s for their emission scenarios.
How does SRES A2 compare with the RCP future projections?
Although the IPCC’s Fifth Assessment Report (AR5) is based primarily on results from the CMIP5 modelling using RCPs, the report also uses results from the SRES CMIP3 modelling and therefore identifies similar scenarios from each set.
For the latter half of the 21st century, SRES A2 has a similar trajectory to that of RCP8.5, with both reaching about 8 W/m² by 2100 (Figure a). SRES A2 is also similar to RCP8.5 in terms of changes in global mean temperature (Figure b).
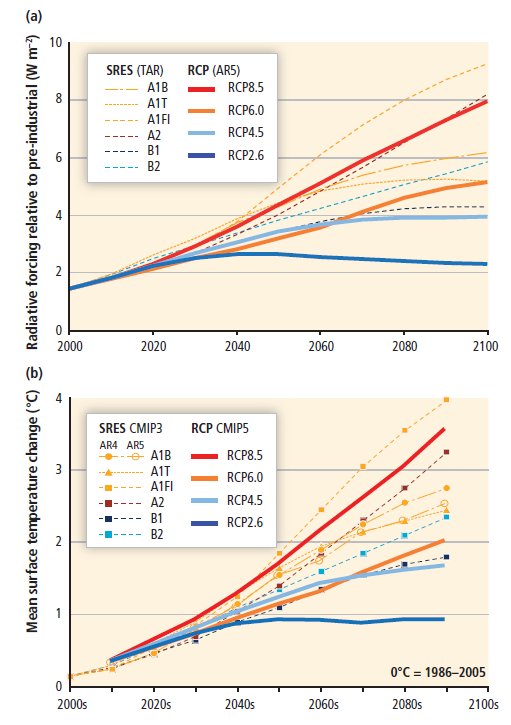
Figure (a) Projected radiative forcing (W/m²) and (b) global mean surface temperature change (°C) over the 21st century, as determined by using the Special Report on Emissions Scenarios (SRES) and Representative Concentration Pathway (RCP) scenarios (ref) (temperature changes are decadal averages based on the model ensemble mean). Figure (b)
For RCP8.5, global mean surface temperatures for 2081 to 2100, compared with those for 1986 to 2005, are likely to be in the range of 2.6 C to 4.8°C higher, with a multi-model mean increase of 3.7°C4. The projected warming for SRES A2 for the 2090 to 2099 period, relative to 1980 to 1999, is given by IPCC AR4 as 2.0°C to 5.9°C, with a best estimate of 3.4°C.(25)
ACCESSING DATA ON THE PORTAL
Accessing data on the Climate Data Portal is a simple process of creating a user account and searching the data. There are resources available to assist in this process, including our team of climate researchers. Please review and consider the terms of use provided on this webpage, including how the Department protects your privacy and the need for users to appropriately acknowledge the data.
Types of user accounts
Currently, there are two levels of registered user accounts on the Climate Data Portal: ‘read only’ and ‘technical user.’ When an account is created, it is initially designated read only access. Read only users can see all datasets and read metadata and descriptions, but are unable to download data. Technical users can download all datasets.
Creating a user account
Select the Login button (top right) to create an account. Once an account is created, you will receive an email confirmation. To be granted technical user status, you will need to complete a short survey so we can better understand your data needs.
Searching the data
From the homepage, select the Data tab. Search by keyword or use the filters on the left to focus your choices.
Note: certain search criteria will remove some search options. For example, by selecting NARCliM, you will only be able to see options for NARCliM data. You will not see options for CORDEX data. As you filter, datasets that meet the criteria will be visible on the right side. Basic descriptions are provided with each returned dataset to assist searching.
Selecting and downloading data
Once you have searched, filtered and located your dataset of interest, click on the name. You’ll be redirected to a page describing the dataset. From here you can download the dataset. If multiple datasets meet your criteria, you have the option of downloading a single dataset, multiple datasets individually, or you can download them all at once.
Data licensing
This NSW Climate Data Portal website contains information, data, documents, pages and images prepared by the NSW Government Department of Planning, Industry and Environment (‘the Department’) and third parties. The Department supports and encourages the dissemination and exchange of publicly funded information and endorses the use of the Australian Governments Open Access and Licensing Framework (AusGOAL). Unless otherwise stated, all Department material available on the NSW Climate Data Portal is licensed under the Creative Commons Attribution 4.0 International (CC BY 4.0). The license terms can be viewed at Creative Commons.
Data disclaimer
Data available on the NSW Climate Data Portal has been prepared in good faith, exercising all due care and attention, but no representation, express warranty or implied warranty, is made to the relevance, accuracy, completeness or fitness for purpose of this information in respect of any particular user circumstances. The climate data projections include an inherent degree of uncertainty. You are responsible for assessing the relevance of the data for your intended purposes.
The Department endeavours to make sure that information provided on this website is correct at the time of its publication. However, as necessary you should obtain independent advice before making any decision based on the information on this site. The information on this site is made available on the understanding that the State of New South Wales and the Department accept no responsibility or liability for any damage, cost, loss or expense incurred by you as a result of:
- any error, omission or misrepresentation on this site
- any malfunction or failure to function of this site
- reliance upon this website’s material or any linked sites
- without limiting the above, any delay, failure or error in recording, displaying or updating information, including but not limited to, data relating to credit holdings.
Where there are known limitations to the information provided online, we will include an explanation of these limitations wherever possible. If there is any material that you consider to be misleading or inaccurate, please let us know and it will be corrected as soon as possible.
Your privacy
The Department will handle information you enter to access the NSW Climate Data Portal in accordance with the NSW Government’s and the Department’s privacy and security policies. The Department’s privacy practices are regulated by the Privacy and Personal Information Protection Act 1998 (NSW) and the Department’s privacy management plan. We will not disclose your personal information to anyone without your consent, unless legally required to do so. Your consent to disclose information may be sought by us or given by yourself for a specific purpose. For more information, please visit the Department’s privacy webpage.
Acknowledging the use of NARCliM data
Written work of any form, based in whole or in part on data provided by the NSW Climate Data Portal will acknowledge the data has been provided by the Government of New South Wales, Australia. This written work will include the following acknowledgement:
For NARCliM Project data released in 2014, ‘NARCliM1.0’:
This work used data derived from the NSW and ACT Regional Climate Modelling (NARCliM)1.0 project and provided by the Government of New South Wales, Australia.
Citation: Evans JP, Ji F, Lee C, Smith P, Argueso D and Fita L 2014, Design of a regional climate modelling projection ensemble experiment, Geoscientific Model Development, 7, pp.621–629. Data accessed via the NSW Climate Data Portal [on date].
For NARCliM Project data released in 2020, ‘NARCliM1.5’:
This work used data derived from the NSW and ACT Regional Climate Modelling (NARCliM) Expansion (1.5) project and provided by the Government of New South Wales, Australia.
Citation: Nishant N, Evans JP, DiVirgilio G, Downes S, Cheung KW, Tam E, Miller J, Beyer K and Riley M, Introducing NARCliM1.5: evaluating the performance of regional climate projections for southeast Australia for 1950–2100 (Submitted for publication). Data accessed via the NSW Climate Data Portal [on date].
ABOUT US
The DPIE Climate Research Team
The NARCliM project was developed, led and delivered by the Climate Research Team at the NSW Department of Planning, Industry and Environment (DPIE), in partnership with the University of New South Wales (UNSW). The Climate Research Team has collaborative research relationships with various research partners including universities, other jurisdictions and institutions such as CSIRO and the Bureau of Meteorology.
We are a multi-disciplinary team that delivers complex and integrated climate impacts and adaptation research. Our key research areas include understanding the past, present and future climate of NSW and the impacts of climate change on NSW communities and environment. Our specific research areas include:
- Providing up-to-date, fit-for-purpose and target climate data to NSW communities
- Designing and delivering enhanced regional climate projections
- Extreme weather and climate events
- Climate change impacts on biophysical systems, such as hydrology, bushfire, biodiversity, etc.
- Natural hazard mapping for future climates
- Climate change impacts in NSW’s Alpine region
- Urban heat and green cover research and evaluation
- Climate change impacts on socio-economic systems, including vulnerable communities, economic sectors of NSW and integrated regional impacts
- Human Health & Social Impacts of Climate Change (the fourth research node of the NSW Adaptation Research Hub; established in 2017)
The Climate & Atmospheric Sciences Branch
The Climate Research Team works within the Climate & Atmospheric Science Branch, which is a part of the Science Division in the Energy, Environment & Science Directorate. The Branch is responsible for delivery of the priority climate and atmospheric science needs of DPIE and the Environment Protection Authority (EPA) which are outlined in two of the agency’s Knowledge Strategy theme areas - Pollution, Resource Efficiency and Climate Change Impacts and Adaptation.
The Branch supports DPIE to meet its goals to “Support economic development without devaluing the environment” and “Build resilience to climate change and environmental hazards and risks”. See the DPIE website for more information.
The Branch delivers NSW Government priorities in climate and air quality science, identifies emerging research needs, and provides the public with information on climate change and air quality in their region.
Other datasets managed by the Climate Research Team
In addition to our regional climate simulations, the Climate Research Team led the Urban Heat and Green Cover (UHGC) project, which delivered the following datasets:
- NSW Urban Vegetation Cover to Modified Mesh Block 2016
- Greater Sydney Region Urban Vegetation Cover to Modified Mesh Block 2016
- NSW Heat Vulnerability Index to ABS SA1 Level 2016
- NSW Urban Heat Island to Modified Mesh Block 2016
Further datasets will be released in the coming months. These are:
- NSW Urban Vegetation Cover 2016 imagery
- Land surface temperature and urban heat imagery
- 2014 data for selected priority precincts
Data from the UHGC Project is available through the NSW Sharing and Enabling Environmental Data portal (SEED). Please visit the SEED portal to access datasets on urban vegetation cover, land surface temperatures and areas of heat vulnerability.
Future work
Currently, the Climate Research Team is working on the next generation of regional climate projections for southeast Australia, NARCliM1.5. It is expected that NARCliM1.5 will be completed and ready for download by the end of 2020. NARCliM1.5 will provide continuous data from 1951 to 2100, use updated global climate models from CMIP5 and provide projections assuming two different greenhouse gas scenarios (RCP4.5 and RCP8.5).
The Climate Research Team are using NARCliM to develop projections of natural hazards over southeast Australia for the 21st century. These include projections of heatwaves, extreme rainfall, drought, bushfire weather, thunderstorms and other natural hazards. The natural hazard projections will be made available as they are developed. Research into the likelihood of co-occurring natural hazards and the compounding effects of natural hazards is also being conducted. The final phase of this project will assess the economic impact that projected natural hazards could have on NSW.
The Climate Research Team will use outputs from NARCliM and the natural hazards project to improve the climate data available to infrastructure owners. This will include improving our understanding of how infrastructure owners and managers use climate data and tools to integrate climate change information into their decision-making process.
CONTACT US
For comments, questions or to explore research collaborations please contact us at climate.research@environment.nsw.gov.au
CITATIONS
- Evans JP, Ji F, Lee C, Smith P, Argüeso D and Fita L (2014) Design of a regional climate modelling projection ensemble experiment – NARCliM (PDF 1.43 MB). Geosci. Model Dev., 7, 621–629.
- NARCliM 10-km domain covers south-eastern Australia and much of the Tasman Sea (135-165E, 23-40S).
- Giorgi F, Jones C and Asrar GR (2009) Addressing climate information needs at the regional level: the CORDEX framework (PDF 504 KB), WMO Bulletin, 58(3), 175–183.
- Evans JP and Ji F (2012). Choosing GCMs, NARCliM Technical Note 1, NARCliM Consortium, Sydney, Australia.
- Bishop CH and Abramowitz G (2013). Climate model dependence and the replicate earth paradigm. Clim. Dynam., 41, 885–900, doi:10.1007/s00382-012-1610-y.
- Evans JP and Ji F (2012). Choosing the RCMs to perform the downscaling (PDF 298 KB). NARCliM Technical Note 2, 8 pp., NARCliM Consortium, Sydney, Australia.
- Evans JP and McCabe MF (2010) Regional climate simulation over Australia’s Murray-Darling Basin: a multi-temporal assessment, J. Geophys. Res.-Atmos., 115, D14114, doi:10.1029/2010JD013816.
- Evans JP and McCabe MF (2013) Effect of model resolution on a regional climate model simulation over south-east Australia, Clim. Res., 56, 131–145, doi:10.3354/cr01151.
- Skamarock WC, Klemp JB, Dudhia J, Gill DO, Barker DM, Duda MG, Huang XY, Wang W, and Powers JG (2008). A Description of the Advanced Research WRF Version 3, NCAR Technical Note, National Center for Atmospheric Research, Boulder, CO, USA.
- National Center for Atmospheric Research(NCAR) 2004, National Center for Atmospheric Research, USA, viewed 7 August 2014.
- Evans JP, Ji F, Abramowitz G, and Ekstrom M (2013). Optimally choosing small ensemble members to produce robust climate simulations. Env. Res. Letters, 8(4), doi:10.1088/1748-9326/8/4/044050
- Ji F, Ekström M, Evans JP, and Teng J (2014). Evaluating rainfall patterns using physics scheme ensembles from a regional atmospheric model. Theor. Appl. Clim., 115, 297–304, doi:10.1007/s00704-013-0904-2
- Olson, R., J. P. Evans, D. Arg¨ueso and A. Di Luca, 2014: NARCliM Climatological Atlas. NARCliM Technical Note 4, 417 pp, NARCliM Consortium, Sydney, Australia.
- Jones, D. A., Wang, W. and Fawcett, R. 2009. High-quality spatial climate data-sets for Australia. Australian Meteorological and Oceanographic Journal, 58, 233-248.
- Ji, F., Evans, J.P, Argueso D. and Di Luca A., NARCliM Data Quality Assurance Report, Report compiled by the Office of Environment and Heritage and the University of NSW.
- Ji F., Evans J.P., Argueso D., Fita L., and Di Luca A. “Using Large-scale Diagnostic Quantities to Investigate Change in East Coast Lows”, submitted to Climate Dynamics.
- Foley, A.M., 2010. Uncertainty in regional climate modelling: A review. Progress in Physical Geography, 34(5), pp.647-670.
- Déqué, M. and Somot, S., 2010. Weighted frequency distributions express modelling uncertainties in the ENSEMBLES regional climate experiments. Climate Research, 44(2-3), pp.195-209.
- Tebaldi, C., Mearns, L.O., Nychka, D. and Smith, R.L., 2004. Regional probabilities of precipitation change: A Bayesian analysis of multimodel simulations. Geophysical Research Letters, 31(24).
- Tebaldi, C., Smith, R.L., Nychka, D. and Mearns, L.O., 2005. Quantifying uncertainty in projections of regional climate change: A Bayesian approach to the analysis of multimodel ensembles. Journal of Climate, 18(10), pp.1524-1540.
- Buser, C.M., Künsch, H.R. and Schär, C., 2010. Bayesian multi-model projections of climate: generalization and application to ENSEMBLES results. Climate Research, 44(2-3), pp.227-241.
- Peters GP, Andrew RM, Boden T, Canadell JG, Ciais P, Le Quere C, Marland G, Raupach MR, Wilson C. Com mentary: The challenge to keep global warming below 2 degrees C Nature Climate Change 2013, 3:4-6.
- Rahmstorf S, Cazenave A, Church JA, Hansen JE, Keeling RF, Parker DE, Somerville RCJ. Recent climate observations compared to projections Science 2007, 316:709-709.
- Peters GP, Andrew RM, Boden T, Canadell JG, Ciais P, Le Quere C, Marland G, Raupach MR, Wilson C. Commentary: The challenge to keep global warming below 2 degrees C Nature Climate Change 2013, 3:4-6.
- IPCC, 2007: Summary for Policymakers. In: Climate Change 2007: The Physical Science Basis. Contribution of Working Group I to the Fourth Assessment Report of the Intergovernmental Panel on Climate Change [Solomon, S, D Qin, M Manning, Z Chen, M Marquis, K B Averyt, M Tignor and H.L Miller (eds.)]. Cambridge University Press, Cambridge, United Kingdom and New York, NY, USA, https://www.ipcc.ch/site/assets/uploads/2018/02/ar4-wg1-spm-1.pdf
- IPCC (2013) Climate Change 2013: The Physical Science Basis. Contribution of Working Group I to the Fifth Assessment Report of the Intergovernmental Panel on Climate Change. Stocker, TF, Qin D, Plattner GK, Tignor M, Allen K, Boschung J, Nauels A, Xia Y, Bex V, and Midgley PM (eds.). Cambridge University Press, Cambridge, United Kingdom and New York, NY, USA. 1535 pp., doi:10.1017/CBO9781107415324.
Using NARCliM 1.5
Reference list for NARCliM data
The following reference list represents many key publications addressing the performance and application of the NARCliM data.
Cortés-Hernández VE, Zheng F, Evans JP, Lambert M, Sharma A, and Westra S 2015, Evaluating regional climate models for simulating sub-daily rainfall extremes, Climate Dynamics, DOI: 10.1007/s00382-015-2923-4.
Di Virgilio G, Evans JP, Di Luca A, Olson R, Argüeso D, Kala J, Andrys J, Hoffmann P, Katzfey JJ and Rockel B 2019, Evaluating reanalysis-driven CORDEX regional climate models over Australia: model performance and errors, Climate Dynamics, vol.53, pp.2985–3005, DOI: 10.1007/s00382-019-04672-w.
USEFUL LINKS
NSW Climate Change Fund (CCF), from which NARCliM has been funded
Bureau of Meteorology – Influences on the Australian climate
Australian Capital Territory Climate Change Strategy
Victorian Climate Projections 2019
Western Australia Climate Change
NARCliM information from the University of New South Wales
Explaining climate science and concepts and reducing misinformation